In the graph plotted between vapour pressure ( V . P .) and temperature (Δ T ),
Chemistry · Class 12 · CBSE — Solutions
In the graph plotted between vapour pressure (V.P.) and temperature (ΔT),
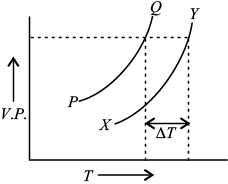
- PQ is the curve for solvent, XY is the curve of solution and DT is depression in freezing point
- PQ is the curve for solution, XY is the curve for solvent and DT is elevation in boiling point
- PQ is the curve for solvent, XY is the curve for solution and DT is molal elevation in boiling point
- PQ is the curve for solvent, XY is the curve for solution and DT is elevation in boiling point.
Answer
(D) PQ is the curve for solvent, XY is the curve for solution and D T is elevation in boiling point.
Sign up free on Edukali to view the step-by-step worked solution and practice thousands of similar questions.
Related practice questions
- Osmotic pressure is widely used to determine molar masses of proteins and polymers. Two solutions having same…
- What weight of glycerol should be added to 600 g of water in order to lower its freezing point by 10°C? ( K f…
- How many grams of NaOH are present in 250 mL of 0.5 M NaOH solution?
- What will be the mole fraction of ethanol in a sample of spirit containing 85% ethanol by mass?
- What will be the osmotic pressure in pascals exerted by a solution prepared by dissolving 1.0 g of polymer of…
- For carrying reverse osmosis for desalination of water the material used for making semipermeable membrane is
- An aqueous solution of 2% non-volatile solute exerts a pressure of 1.004 bar at the normal boiling point of…
- In ccp arrangement the pattern of successive layers can be designated as