The voltage time (V–t) graph for triangular wave having peak value. V 0 is as shown in…
Physics · JEE Advanced · NTA Exams — Electromagnetic Induction and Alternating Currents
The voltage time (V–t) graph for triangular wave having peak value. V0 is as shown in figure
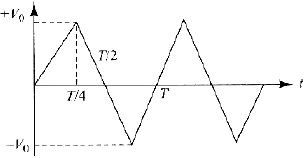
The rms value of V in time interval from t = 0 to T/4 is
The rms value of V in time interval from t = 0 to T/4 is
- \(\frac{\mathrm{V}_{0}}{\sqrt{3}}\)
- \(\frac{V_{0}}{2}\)
- \(\frac{\mathrm{V}_{0}}{\sqrt{2}}\)
- None of these
Answer
(A) V _ 0 3
Sign up free on Edukali to view the step-by-step worked solution and practice thousands of similar questions.
Related practice questions
- A region in the form of an equilateral triangle (in x - y plane) of height L has a uniform magnetic field…
- A small bar magnet is being slowly inserted with constant velocity inside a solenoid as shown in figure…
- A circular conducting loop of radius r 0 and having resistance per unit length λ as shown in the figure is…
- A conducting loop in the shape of a right angled isosceles triangle of height 10 cm is kept such that the 90°…
- A light disc made of aluminium (a non-magnetic material) is kept horizontally and is free to rotate about its…
- A wire cd of length l and mass m is sliding without friction on conducting rails ax and by as shown. The…
- A uniform but time-varying magnetic field B ( t ) exists in a circular region of radius a and is directed…
- The magnetic field within a long, straight solenoid with a circular cross section and radius R is increasing…
More Electromagnetic Induction and Alternating Currents questions · Browse all practice questions