The graph of the total number of α-particles scattered at different angles in a given…
Physics · Class 12 · CBSE — Atoms
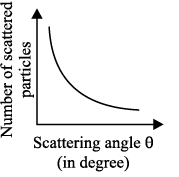
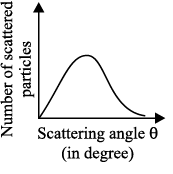
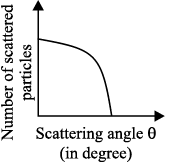
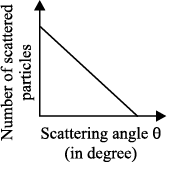
The graph of the total number of α-particles scattered at different angles in a given interval of time for α-particle scattering in the Geiger-Marsden experiment is given by
Answer
(A)
Sign up free on Edukali to view the step-by-step worked solution and practice thousands of similar questions.
Related practice questions
- The ground state energy of hydrogen atom is –13.6 eV. The kinetic energy of the electron in this state is
- An electron is in an excited state in a hydrogen like atom. It has a total energy of –3.4 eV. The kinetic…
- In Bohr model of the hydrogen atom, the potential energy of electron in the ground state is:
- Energy E of a hydrogen atom with principal quantum number n is given by E= -13.6 n^ 2 eV The energy of a…
- An electron is revolving in the n th orbit of radius 4.2 Å, then the value of n is ( r 1 = 0.529 Å)
- A 10 kg satellite circles earth once every 2 h in an orbit having a radius of 8000 km. Assuming that Bohr’s…
- The minimum energy that must be given to a H atom in ground state so that it can emit an H γ line in Balmer…
- In an atom the ratio of radius of orbit of electron to the radius of nucleus is