The graph between the stopping potential ( V 0 ) and (1/λ) is shown in the figure φ 1 , φ…
Chemistry · JEE Advanced · NTA Exams — Atomic Structure
The graph between the stopping potential (V0) and (1/λ) is shown in the figure φ1, φ2 and φ3 are work functions. Which of the following is/are correct?
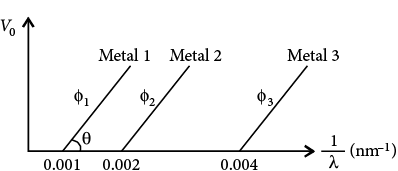
- f1 : f2 : f3 = 1 : 2 : 4
- f1 : f2 : f3 = 4 : 2 : 1
- tanq is directly proportional to
 where h is Planck’s constant and c is the speed of light
 - Ultra violet light can be used to emit photoelectrons from metal 2 and metal 3 only.
Answer
(B) f 1 : f 2 : f 3 = 4 : 2 : 1
Sign up free on Edukali to view the step-by-step worked solution and practice thousands of similar questions.
Related practice questions
- According to Bohr’s model, the highest kinetic energy is associated with the electron in the
- The nucleus of an atom can be assumed to be spherical. The radius of the nucleus of mass number A is given by…
- Electromagnetic wave theory was proposed by James Clark Maxwell in 1864 . Acc. to this theory, the energy is…
- In a photoelectric experiment anode potential is plotted against plate current
- Photoelectric effect experiments are performed using three different metal plates p, q and r having work…
- If the value of (n + l ) is more than 3 and less than 6, then what will be the possible number of orbitals ?
- Assertion : Emission spectrum of a pure atom is line spectrum, not the continuous. Reason : Energy of the…
- Assertion (A) : Charge Mass ratio of anode rays is found different for different gases. Reason : Proton is…
More Atomic Structure questions · Browse all practice questions