The given graph shows the vapour pressure-temperature curves for some liquids. Liquids A…
Chemistry · Class 12 · CBSE — Solutions
The given graph shows the vapour pressure-temperature curves for some liquids.
Liquids A, B, C and D respectively are
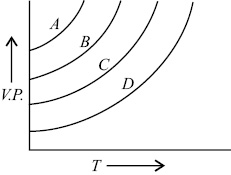
- diethyl ether, acetone, ethyl alcohol, water
- acetone, ethyl alcohol, diethyl ether, water
- water, ethyl alcohol, acetone, diethyl ether
- ethyl alcohol, acetone, diethyl ether, water.
Answer
(A) diethyl ether, acetone, ethyl alcohol, water
Sign up free on Edukali to view the step-by-step worked solution and practice thousands of similar questions.
Related practice questions
- Which of the following statements is correct about diffusion and osmosis? (i) In osmosis, a semipermeable…
- In the graph plotted between vapour pressure ( V . P .) and temperature (Δ T ),
- How many grams of NaOH are present in 250 mL of 0.5 M NaOH solution?
- Osmotic pressure is widely used to determine molar masses of proteins and polymers. Two solutions having same…
- 250 mL of sodium carbonate solution contains 2.65 g of Na 2 CO 3 . If 10 mL of this solution is diluted to…
- What will be the freezing point of a 0.5 m KCl solution? The molal freezing point constant of water is 1.86°…
- Solubility of a substance is its maximum amount that can be dissolved in a specified amount of solvent. It…
- Which of the following solutions is an example of negative deviation from Raoult’s law?