Volume versus temperature graph of an ideal gas of equal number of moles of different…
Chemistry · NEET · NTA Exams — States of Matter
Volume versus temperature graph of an ideal gas of equal number of moles of different volumes is plotted as shown in figure. Choose the correct alternative.
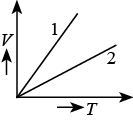
- V1 > V2
- P1 > P2
- P1 < P2
- P1 = P2
Answer
(C) P 1 P 2
Sign up free on Edukali to view the step-by-step worked solution and practice thousands of similar questions.
Related practice questions
- One third mole each of nitrogen, oxygen and carbon dioxide are mixed in enclosure of volume 5 litres and…
- A cylinder contains 10 kg of gas at a pressure of 10 7 Nm –2 . The quantity of gas taken out of the cylinder…
- Critical temperature of CO 2 is 31.2°C. In summer, the room temperature is 40°C.
- A balloon contains 1500 m 3 of helium at 27°C and 3 atmospheric pressures. The volume of helium at −3°C…
- The volume of vessel A is twice the volume of another vessel B, and both of them are filled with the same…
- Pressure versus temperature graph of an ideal gas of equal number of moles of different volumes is plotted as…
- Given below are two statements Statement I : At low density, variable of gases P, V and T follows the…
- Volume versus temperature graphs for a given mass of an ideal gas is shown in figure at two different values…
More States of Matter questions · Browse all practice questions