Volume versus temperature graphs for a given mass of an ideal gas is shown in figure at…
Chemistry · NEET · NTA Exams — States of Matter
Volume versus temperature graphs for a given mass of an ideal gas is shown in figure at two different values of constant pressure. What can be inferred about relation between P1 and P2?
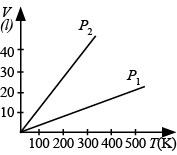
- P1> P2
- P1= P2
- P1< P2
- Data is insufficient
Answer
(C) P 1 2
Sign up free on Edukali to view the step-by-step worked solution and practice thousands of similar questions.
Related practice questions
- One third mole each of nitrogen, oxygen and carbon dioxide are mixed in enclosure of volume 5 litres and…
- A closed bottle containing water at is open on the surface of the moon. then
- The volume of vessel A is twice the volume of another vessel B, and both of them are filled with the same…
- NH 3 and HCl gas are introduced simultaneoulsy from the two ends of a long tube. A white ring of NH 4 Cl…
- Critical temperature of CO 2 is 31.2°C. In summer, the room temperature is 40°C.
- An air bubble of volume 1.0 cm 3 rises from the bottom of a lake 30 m deep at a temperature of 12°C. To what…
- Pressure versus temperature graph of an ideal gas of equal number of moles of different volumes is plotted as…
- A balloon contains 1500 m 3 of helium at 27°C and 3 atmospheric pressures. The volume of helium at −3°C…
More States of Matter questions · Browse all practice questions