Following figure represents simulated titration curves for solutions of four acids…
Chemistry · JEE Advanced · NTA Exams — Equilibrium
Following figure represents simulated titration curves for solutions of four acids titrated with the same standard base solution. Based on these titration curves, we can accurately predict that
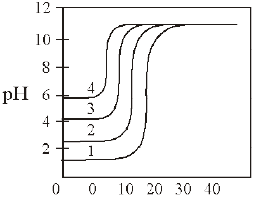
- Curve 4 represents the smallest concentration and the weakest acid.
- Curve 1 represents the largest concentration and the strongest acid.
- The dissociation constant for the acid represented by curve 3 is about 1 × 10⁻⁴ (i.e., Ka = 1 × 10⁻⁴).
- All the responses above are correct.
Answer
(D) All the responses above are correct.
Sign up free on Edukali to view the step-by-step worked solution and practice thousands of similar questions.
Related practice questions
- For the overall reaction H _ 2 ~S ( aq ) 2 H ^ + ( aq )+ S ^ 2- ( aq ) , the value of K a is 1×10 –22 . The K…
- For the overall reaction H 2 S(aq) ⇌ 2H + (aq) + S 2– (aq), the value of K a is 1 × 10 –22 . The K sp for FeS…
- Volume of the flask in which the following equilibria are separately established are transferred to a flask…
- The precipitate of CaF 2 ( K sp = 1.7 × 10 –10 ) is obtained when equal volumes of the following are mixed
- When two reactants, A and B are mixed to give products C and D, the reaction quotient Q, at the initial…
- Which among the following represent the conjugate acid/base pairs ?
- Assertion : For the reaction A ( ~g )+ B ( ~g ) 2 AB ( ~g ) at the given temperature, there will be no effect…
- When one drop of a concentrated HCl is added to 1 L of pure water at 25ºC, the pH drops suddenly from 7 to 4…