The current-voltage graph for a device is shown in the figure. The resistance is negative…
Physics · Class 12 · CBSE — Current Electricity
The current-voltage graph for a device is shown in the figure. The resistance is negative in the region:
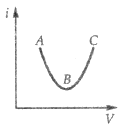
- AB
- BC
- ABC
- CA
Answer
(B) BC
Sign up free on Edukali to view the step-by-step worked solution and practice thousands of similar questions.
Related practice questions
- The internal resistance of a cell of emf 2 V is 0.1 . It is connected to a resistance of 3.9 . The voltage…
- In the network shown in figure, the values of V 0 and I are
- A steady current I is passed through a conductor at room temperature for time t. It is observed that its…
- A battery of e.m.f. 12 V and internal resistance 0.5 is connected to a 9.5 resistor through a key. The ratio…
- A cell of emf (E) and internal resistance r is connected across a variable external resistance R. The graph…
- The mean free path of conduction electrons in copper is about 4 × 10 –8 m. The electric field which can give…
- A hot electric iron has a resistance of 80 and is used on a 200 V source. The electrical energy spent, if it…
- Kirchhoff s first rule at a junction in an electrical network, deals with conservation of
More Current Electricity questions · Browse all practice questions