Which of the following curves, figure correctly represent the variation of capacitive…
Physics · JEE Main · NTA Exams — Electromagnetic Induction and Alternating Currents
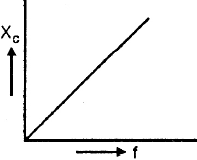
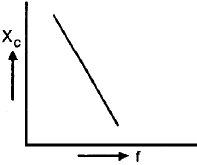
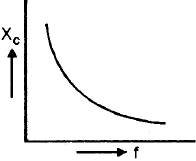
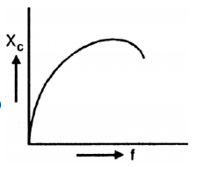
Which of the following curves, figure correctly represent the variation of capacitive reactance (XC) with frequency (f) ?
Answer
(C)
Sign up free on Edukali to view the step-by-step worked solution and practice thousands of similar questions.
Related practice questions
- The magnetic flux linked with a circuit of resistance 100 ohm increases from 10 to 60 weber. The amount of…
- In a uniform magnetic field of induction B , a wire in the form of semicircle of radius r rotates about the…
- An alternating voltage E = 200 2 sin (100 t) volt is connected to a 1 µ F capacitor through an A.C. ammeter…
- The flux linked with a coil at any instant t is given by φ = 10 t 2 – 50t + 250 The induced emf at t = 3 s is
- Two coils of self-inductances 2 mH and 8 mH are placed so close to each other that the effective flux in one…
- A loop of area 0.1 m 2 rotates with a speed of 60 rps perpendicular to a magnetic field of 0.4 T. If there…
- When magnetic flux through a coil is changed, the variation of induced current in the coil with time is as…
- A magnet is moved towards a coil: rapidly slowly Then, the induced emf is
More Electromagnetic Induction and Alternating Currents questions · Browse all practice questions