P-V plots for two gases during adiabatic processes are shown in the figure. Plots 1 and 2…
Physics · JEE Advanced · NTA Exams — Kinetic Theory of Gases
P-V plots for two gases during adiabatic processes are shown in the figure. Plots 1 and 2 should correspond respectively to
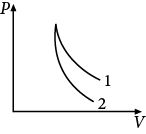
- He and O2
- O2 and He
- He and Ar
- O2 and N2.
Answer
(B) O 2 and He
Sign up free on Edukali to view the step-by-step worked solution and practice thousands of similar questions.
Related practice questions
- Tyre of a bicycle has volume 2 × 10 -3 m 3 . Initially the tube is filled to 75% of its volume by air at…
- In the figure shown, a horizontal cylindrical tube connected to the vertical wall of a chamber of volume V…
- For the P–V diagram shown, for path 1 → 2 → 3, 100 J of heat is given to the system and 40 J of work is done…
- One mole of diatomic ideal gas undergoes a cyclic process ABC as shown in figure. The process BC is…
- The root mean square velocity of one mole of a monoatomic gas having molar mass M is u r . m . s . . The…
- An ideal monoatomic gas is confined in a horizontal cylinder by a spring loaded piston (as shown in the…
- If one mole of a monoatomic gas (γ = 5/3) is mixed with one mole of a diatomic gas (γ = 7/5), the value of g…
- Four curves A , B , C and D are drawn in the adjoining figure for a given amount of gas. The curves which…
More Kinetic Theory of Gases questions · Browse all practice questions