The graph, shown in the adjacent diagram, represents the variation of temperature ( T )…
Physics · JEE Advanced · NTA Exams — Thermodynamics
The graph, shown in the adjacent diagram, represents the variation of temperature (T) of two bodies, x and y having same surface area, with time (t) due to the emission of radiation.
Find the correct relation between the emissivity and absorptivity powers of the two bodies.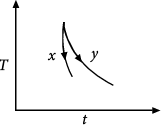
Find the correct relation between the emissivity and absorptivity powers of the two bodies.
- Ex > Ey and ax < ay
- Ex < Ey and ax > ay
- Ex > Ey and ax > ay
- Ex < Ey and ax < ay.
Answer
(A) E x > E y and a x a y
Sign up free on Edukali to view the step-by-step worked solution and practice thousands of similar questions.
Related practice questions
- Three rods of same dimensions have thermal conductivities 3k, 2k and k. They are arranged as shown, with…
- Suppose the specific heat capacity of a substance is varying with temperature according to, s = A + BT 2…
- Find the ratio of the lengths of an iron rod and an aluminium rod for which the difference in the lengths is…
- A thermally insulating cylinder has a thermally insulating and frictionless movable partition in the middle…
- If a black body radiates 10 cal/s at 227°C, it will radiate at 727°C :
- A monoatomic ideal gas, initially at temperature T 1 , is enclosed in a cylinder fitted with a frictionless…
- Statement - 1 : Two stars S 1 and S 2 radiate maximum energy at 360 nm and 480 nm, respectively. Ratio of…
- An ideal gas is taken through the cycle A → B → C → A , as shown in the figure. If the net heat supplied to…
More Thermodynamics questions · Browse all practice questions