The graph between two temperature scales A and B is shown in figure. Between upper fixed…
Physics · JEE Main · NTA Exams — Thermodynamics
The graph between two temperature scales A and B is shown in figure.
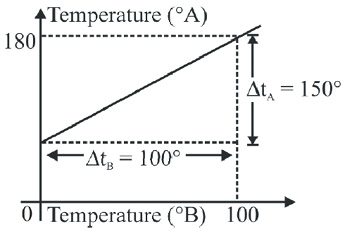
Between upper fixed point and lower fixed point, there are 150 equal divisions on scale A and 100 on scale B. The relationship for conversion between the two scales is given by :
Between upper fixed point and lower fixed point, there are 150 equal divisions on scale A and 100 on scale B. The relationship for conversion between the two scales is given by :
- \(\frac{t_{A}-180}{100}=\frac{t_{B}}{150}\)
- \(\frac{t_{\mathrm{A}}-30}{150}=\frac{t_{\mathrm{B}}}{100}\)
- \(\frac{t_{\mathrm{B}}-180}{150}=\frac{t_{\mathrm{A}}}{100}\)
- \(\frac{t_{\mathrm{B}}-40}{100}=\frac{t_{\mathrm{A}}}{180}\)
Answer
(B) t_ A -30 150 = t_ B 100
Sign up free on Edukali to view the step-by-step worked solution and practice thousands of similar questions.
Related practice questions
- Which of the following is incorrect regarding the first law of thermodynamics?
- If the temperature of a hot body is raised by 5% then the heat energy radiated would increase by
- Given below are two statements. One is labelled as Assertion and the other is labelled as Reason. STATEMENT …
- Two metallic plates of equal thicknesses and thermal conductivities K 1 and K 2 are put together face to face…
- A solid ball of metal has a spherical cavity inside it. If the ball is heated the volume of cavity will :
- A bi-metallic strip is made of two strips A and B having co-efficients of linear expansion α A and α B . If α…
- A sphere of radius r, density ρ and specific heat capacity c, is hung by a thermally insulated thread in an…
- Equal masses of two liquids A and B contained in vessels of negligible heat capacity are supplied heat at the…
More Thermodynamics questions · Browse all practice questions