Among the plots, which of them represent Charle’s law, at constant pressure ?
Chemistry · JEE Advanced · NTA Exams — States of Matter (Gases and Liquids)
Among the plots, which of them represent Charle’s law, at constant pressure ?
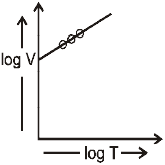
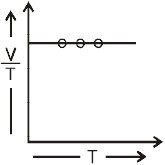
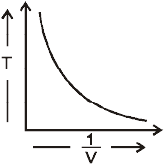
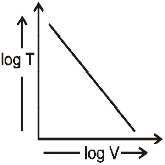
Answer
(A) , (B) , (C)
Sign up free on Edukali to view the step-by-step worked solution and practice thousands of similar questions.
Related practice questions
- A liquid is in equilibrium with its vapour at it’s boiling point. On the average, the molecules in the two…
- At constant volume, for a fixed number of moles of a gas the pressure of the gas increases with rise of…
- Densities of two gases having same molar mass are in the ratio 1 : 2 and their temperatures are in the ratio…
- At the same temperature and pressure, which of the following gases will have the highest average kinetic…
- (P+ n^ 2 a V^ 2 )(V-n b)=n R T Which of the following statements is/are correct ?
- The graph of P vs V is given at different temperatures and number of moles The correct relationship are
- X and Y are two volatile liquids with molar weights of 10 g mol –1 and 40 g mol –1 respectively. Two cotton…
- Assertion (A): The gases He and H 2 are very different in their behaviour at any temperature and pressure but…
More States of Matter (Gases and Liquids) questions · Browse all practice questions