The graph of P vs V is given at different temperatures and number of moles The correct…
Chemistry · JEE Advanced · NTA Exams — States of Matter (Gases and Liquids)
The graph of P vs V is given at different temperatures and number of moles
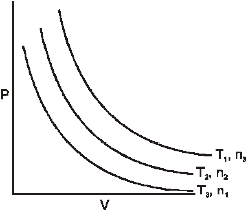
The correct relationship are
The correct relationship are
- T1 > T2 > T3
- T1 < T2 < T3
- n1 > n2 > n3
- n3 > n2 > n1
Answer
(A) T 1 > T 2 > T 3, (D) n 3 > n 2 > n 1
Sign up free on Edukali to view the step-by-step worked solution and practice thousands of similar questions.
Related practice questions
- Which one of the following plot will be a parabola at constant temperature ?
- Density of gas is inversely proportional to temperature and directly proportional to pressure. ⇒ d P ~T ⇒ dT…
- Which of the following gases has the highest value of the van der Waals constant a ?
- Consider the adjacent diagram to answer these questions : Initially, flask A contained oxygen gas at 27ºC and…
- Density of gas is inversely proportional to temperature and directly proportional to pressure. ⇒ d P ~T ⇒ dT…
- (P+ n^ 2 a V^ 2 )(V-n b)=n R T Which of the following statements is/are correct ?
- One mole of a monoatomic real gas satisfies the equation p ( ~V - b )= RT where b is a constant. The…
- Assertion (A): Different gases at the same condition of temperature and pressure have same root mean square…
More States of Matter (Gases and Liquids) questions · Browse all practice questions