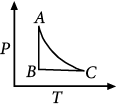
The PT diagram for an ideal gas is shown in the figure, where AC is an adiabatic process…
Physics · JEE Advanced · NTA Exams — Thermodynamics
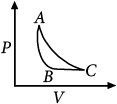
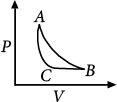
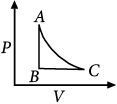
The PT diagram for an ideal gas is shown in the figure, where AC is an adiabatic process. Find the corresponding PV diagram.
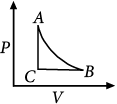
Answer
(B)
Sign up free on Edukali to view the step-by-step worked solution and practice thousands of similar questions.
Related practice questions
- In the figure, the distribution of energy density of the radiation emitted by a black body at a given…
- The plots of intensity versus wavelength for three black bodies at temperatures T 1 , T 2 and T 3…
- A body cools from 50°C to 40°C in 5 min. The surrounding temperature is 20°C. In what further time (in min)…
- Statement - 1 : The coefficient of volume expansion has dimension K –1 . Statement - 2 : The coefficient of…
- A hot body, obeying Newton’s law of cooling is cooling down from its peak value 80 0 C to an ambient…
- A wooden wheel of radius R is made of two semicircular parts (see figure). The two parts are held together by…
- Water is being boiled in a flat bottomed kettle placed on a stove. The area of the bottom is 300 cm 2 and the…
- A block of ice of mass M = 10 kg is moved back and forth over the flat horizontal surface of a large block of…
More Thermodynamics questions · Browse all practice questions