The given graph represent the variations of Z (compressibility factor (Z) = . pV nRT )…
Chemistry · JEE Advanced · NTA Exams — States of Matter (Gases and Liquids)
The given graph represent the variations of Z (compressibility factor (Z) = \(\left.\frac{\mathrm{pV}}{\mathrm{nRT}}\right)\) versus p, for three real gases A, B and C. Identify the only incorrect statement (2006)
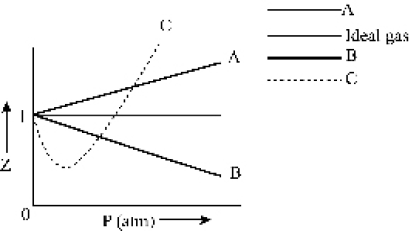
- For the gas A, a = 0 and its dependence on p is linear at all pressure.
- For the gas B, b = 0 and its dependence on p is linear at all pressure.
- For the gas C, which is typical real gas for which neither a nor b = 0. By knowing the minima and the point of intersection, with Z = 1, a and b can be calculated.
- At high pressure, the slope is positive for all real gases.
Answer
(A) For the gas A, a = 0 and its dependence on p is linear at all pressure.
Sign up free on Edukali to view the step-by-step worked solution and practice thousands of similar questions.
Related practice questions
- Consider the adjacent diagram to answer these questions : Initially, flask A contained oxygen gas at 27ºC and…
- Density of gas is inversely proportional to temperature and directly proportional to pressure. ⇒ d P ~T ⇒ dT…
- Helium atom is two times heavier than a hydrogen molecule At 298 K, the average kinetic energy of a helium…
- When an ideal gas undergoes unrestrained expansion, no cooling occurs because the molecules (1984)
- The ratio of root mean square velocity to average velocity of a gas molecule at a particular temperature is…
- Which one of the following plot will be a parabola at constant temperature ?
- Two container each containing liquid water are connected as shown in diagram Given that vapour pressure of H…
- Equal weights of ethane and hydrogen are mixed in an empty container at 25ºC. The fraction of the total…
More States of Matter (Gases and Liquids) questions · Browse all practice questions