Study the given graph showing the effect of light intensity on the rate of…
Biology · Class 11 · CBSE — Photosynthesis in Higher Plants
Study the given graph showing the effect of light intensity on the rate of photosynthesis. Which of the following statements regarding this is correct?
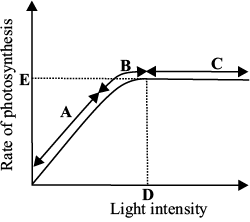
Light is a limiting factor in the region A.
- Region C represents that rate of photosynthesis is not increased further by increasing light intensity because some other factor became limiting.
- Point D represents the intensity of light at which some other factor became limiting.
- All of these
Answer
(D) All of these
Sign up free on Edukali to view the step-by-step worked solution and practice thousands of similar questions.
Related practice questions
- During non-cyclic photophosphorylation, electrons are continuously lost from the reaction centre of PS II…
- If green plant cells are incubated with O 18 - labelled water, which of the following molecules will become…
- In PS I, the reaction centre Chl a has absorption maxima at _______; whereas in PS II, the reaction centre…
- Following table summarizes the differences between light reactions and dark reactions. Light reactions Dark…
- Optimum temperature conditions for photosynthesis in C 3 and C 4 plants are respectively
- Kranz anatomy is not exhibited by which of the following plants?
- Which of the following statements is incorrect regarding the Calvin cycle of C 3 plants ?
- During the different processes of photosynthesis, splitting of water is associated with
More Photosynthesis in Higher Plants questions · Browse all practice questions