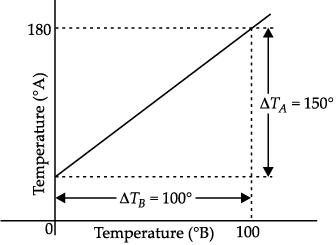
The graph between two temperature scales A and B is shown in figure. Between upper fixed…
Physics · Class 11 · CBSE — Thermal Properties of Matter
The graph between two temperature scales A and B is shown in figure. Between upper fixed point and lower fixed point there are 150 equal division on scale A and 100 on scale B. The relationship for conversion between the two scales is given by
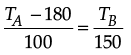
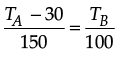
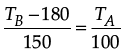
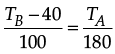
Answer
(C)
Sign up free on Edukali to view the step-by-step worked solution and practice thousands of similar questions.
Related practice questions
- The temperature which has same numerical value on Celsius and Fahrenheit scale is
- The wavelength of maximum intensity of radiation emitted by a star is 289.8 nm. The radiation intensity of…
- In which of the following process convection does not take place primarily?
- To increase the length of brass rod by 2% its temperature should increase by ( a = 0.00002 °C –1 )
- Rays from the sun are focused by a lens of diameter 5 cm on to a block of ice and 10 g of ice is melted in 20…
- A glass full of hot milk is poured on the table. It begins to cool gradually. Which of the following is…
- The volume of a metal sphere increases by 0.24% when its temperature is raised by 40°C. The coefficient of…
- Which of the following graphs correctly shows variation of coefficient of volume expansion of copper as a…
More Thermal Properties of Matter questions · Browse all practice questions