The energy diagram of a reaction P + Q → R + S is given. What are A and B in the graph?
Chemistry · Class 12 · CBSE — Chemical Kinetics
The energy diagram of a reaction P + Q → R + S is given.
What are A and B in the graph?
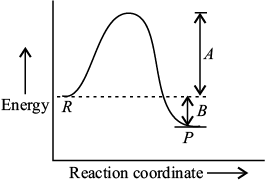
What are A and B in the graph?
- A → activation energy , B → heat of reaction
- A → threshold energy, B → heat of reaction
- A → heat of reaction, B → activation energy
- A → potential energy, B → energy of reaction
Answer
(A) A → activation energy , B → heat of reaction
Sign up free on Edukali to view the step-by-step worked solution and practice thousands of similar questions.
Related practice questions
- For a reaction A 2 + B 2 2 AB the figure shows the path of the reaction in absence and presence of a…
- A first order reaction is 20% complete in 10 minutes. What is the specific rate constant for the reaction?
- For the reaction, 2N 2 O 5 4NO 2 + O 2 , the rate of reaction can be expressed in terms of time and…
- A first order reaction has a rate constant 1.15 × 10 –3 s –1 . How long will 5 g of this reactant take to…
- In a reaction 2 X → Y , the concentration of X decreases from 3.0 moles/litre to 2.0 moles/litre in 5…
- The temperature dependence of the rate of a chemical reaction can be explained by Arrhenius equation which is
- The half-life of the reaction X → Y , following first order kinetics, when the initial concentration of A is…
- Which of the following catalysts is not correctly matched with the reaction?
More Chemical Kinetics questions · Browse all practice questions