The inequality representing the following graph is:
Mathematics · Class 11 · CBSE — Linear Inequalities
The inequality representing the following graph is:
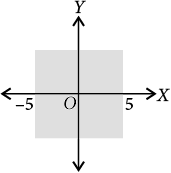
- |x| < 5
- |x| ≤ 5
- |x| > 5
- |x| ≥ 5
Answer
(A) | x | < 5
Sign up free on Edukali to view the step-by-step worked solution and practice thousands of similar questions.
Related practice questions
- If |2 x – 3| x + 5|, then x belongs to
- If 4 x + 3 x +7, then x ∈
- Solutions of the inequalities comprising a system in variable x are represented on number lines as given…
- The length of a rectangle is three times the breadth. If the minimum perimeter of the rectangle is 160 cm…
- Statement-I : If a b , c Statement-II : If both sides are divided by the same negative quantity, then the…
- The inequality x belongs to
- In an experiment, a solution of hydrochloric acid is to be kept between 30° and 35° celsius. What is the…
- Statement-I : If –5 ≤ 2 x + 9 ≤ 2, then x ∈ [–7, –3.5] Statement-II : The graphical representation of –5 ≤ 2…
More Linear Inequalities questions · Browse all practice questions