Figure shows the stress-strain graphs for materials A and B. From the graph it follows…
Physics · JEE Advanced · NTA Exams — Properties of Solids and Liquids
Figure shows the stress-strain graphs for materials A and B.
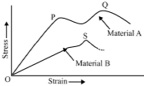
From the graph it follows that
From the graph it follows that
- material A has a higher Young’s modulus
- material B is more ductile
- material A is more brittle
- material A can withstand a greater stress
Answer
(A) material A has a higher Young’s modulus
Sign up free on Edukali to view the step-by-step worked solution and practice thousands of similar questions.
Related practice questions
- Two bodies with volumes V and 2V are equalized on a balance. The larger body is then immersed in oil of…
- A U-tube is partially filled with water. Oil, which does not mix with water, is next poured into one side…
- A cubical block of wood of specific gravity 0.5 and a chunk of concrete of specific gravity 2.5 are fastened…
- Two identical rods are connected between two containers. One of them is at 100°C containing water and another…
- In which of the following processes, convection does not take place primarily ?
- A rod of length 6 m has a mass 12 kg. It is hinged at one end A at a distance of 3 m below the water surface…
- A siphon tube is used to remove liquid from a container as shown in the figure. If the tube is initially…
- Assertion : Young’s modulus for a perfectly plastic body is zero. Reason : For a perfectly plastic body…
More Properties of Solids and Liquids questions · Browse all practice questions