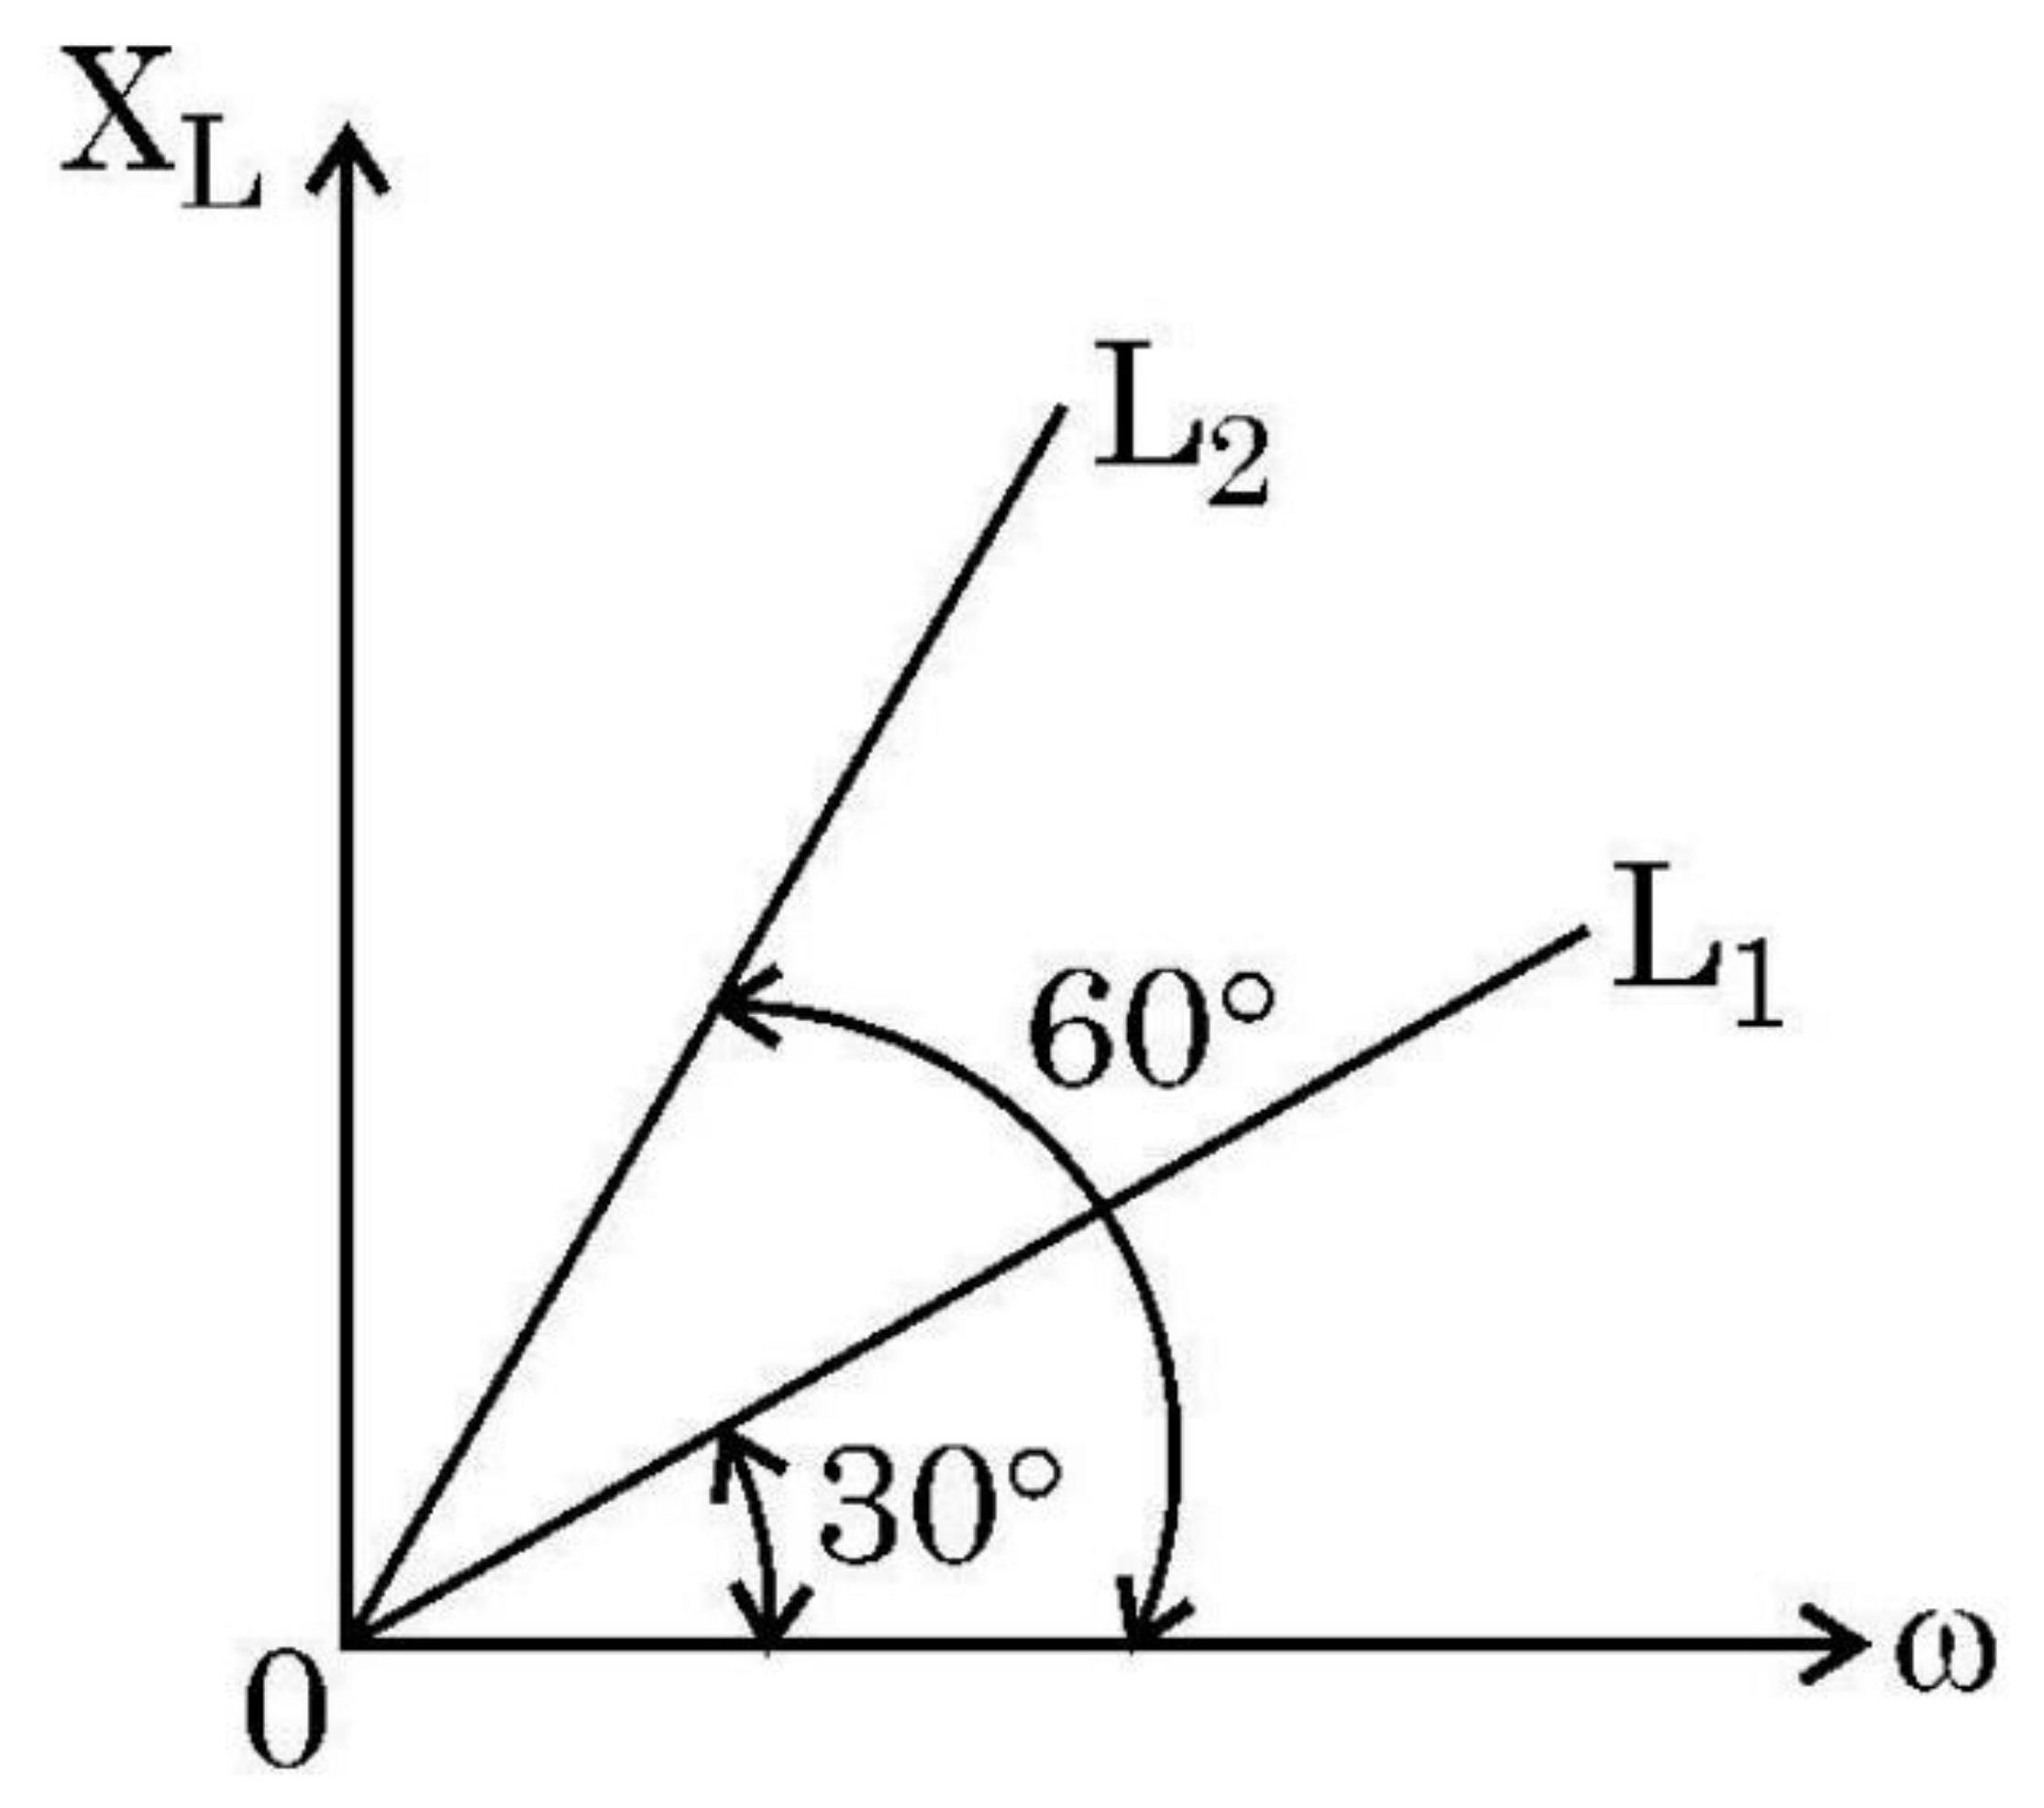
Figure shows the variation of inductive reactance X _ L of two ideal inductors of…
Physics · Class 12 · CBSE — Alternating Current
Figure shows the variation of inductive reactance \({X}_{{L}}\) of two ideal inductors of inductance \(L_{1}\) and \(L_{2}\) , with angular frequency \(\omega\) . The value of \(\frac{{L}_{1}}{{~L}_{2}}\) is
- \(\sqrt{3}\)
- \(\frac{1}{\sqrt{3}}\)
- 3
- \(\frac{1}{3}\)
Answer
(C) 3
Sign up free on Edukali to view the step-by-step worked solution and practice thousands of similar questions.
Related practice questions
- In a uniform magnetic field B a wire in the form of a semicircle of radius r rotates about the diameter of…
- In a step up transformer the turn ratio is 1 : 2. A Leclanche cell (emf = 1.5 V) is connected across the…
- In a series LCR circuit the voltage across the resistance, capacitance and inductance is 10 V each. If the…
- An ideal inductor is connected across an AC source of voltage. The current in the circuit
- The rms value of potential difference V shown in the figure is
- To reduce the resonant frequency in a series LCR circuit with a generator:
- The ratio of the number of turns of the primary to the secondary coils in an ideal transformer is 20: 1 . If…
- A 100 μF capacitor in series with a 40 Ω resistor is connected to a 100 V, 60 Hz supply. The maximum current…
More Alternating Current questions · Browse all practice questions