The strain stress curves of three wires of different materials are shown in the figure…
Physics · JEE Main · NTA Exams — Properties of Solids and Liquids
The strain stress curves of three wires of different materials are shown in the figure. P, Q and R are the elastic limits of the wires. The figure shows that
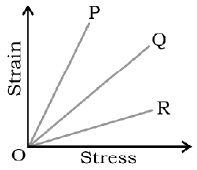
- Elasticity of wire P is maximum
- Elasticity of wire Q is maximum
- Elasticity of R is maximum
- None of the above is true
Answer
(A) Elasticity of wire P is maximum
Sign up free on Edukali to view the step-by-step worked solution and practice thousands of similar questions.
Related practice questions
- If two soap bubbles of different radii are connected by a tube
- A boat 3m long and 2 m wide is floating in a lake. When a man climbs over it, it sinks 1 cm further into…
- The excess pressure across a soap bubble of radius r is p = 4σ/r, where σ is the surface tension of soap…
- Which one of the following is the Young’s modulus (in N/m 2 ) for the wire having the stress-strain curve…
- Which one of the following is not a unit of Young's modulus?
- A wooden block, with a coin placed on its top, floats in water as shown in the figure. The distance h and l…
- A cylinder of height 20 m is completely filled with water. The velocity of efflux of water (in ms –1 )…
- The length of a wire is increased by 1 mm on the application of a given load. In a wire of the same material…
More Properties of Solids and Liquids questions · Browse all practice questions