A graph is plotted between angle of deviation (δ) and angle of incidence (i) for a prism…
Physics · JEE Main · NTA Exams — Optics
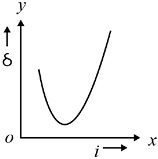
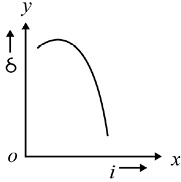
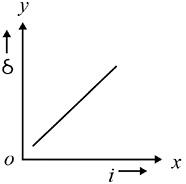
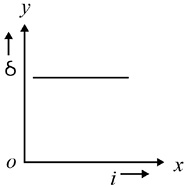
A graph is plotted between angle of deviation (δ) and angle of incidence (i) for a prism. The nearly correct graph is
Answer
(A)
Sign up free on Edukali to view the step-by-step worked solution and practice thousands of similar questions.
Related practice questions
- A double convex lens made of material of refractive index 1.5 and having a focal length of 10 cm is immersed…
- Find the half angular width of the central bright maximum in the Fraunhofer diffraction pattern of a slit of…
- The displacement of the interfering light waves are y1 = 4 sin ωt and y2 = 3 sin (ωt + π/2) What is the…
- In young's double slit experiment angular width of fringes is 0.20^ for sodium light of wavelength 5890 ~A …
- A short linear object of length b lies along the axis of a concave mirror of focal length f at a distance u…
- The curvature radii of a concavo-convex glass lens are 20 ~cm and 60 ~cm . The convex surface of thelens is…
- A concave mirror of focal length f produces an image n times the size of the object. If the image is real…
- A beam of monochromatic blue light of wavelength 4200 A in air travels in water of refractive index 4/3. Its…