In the given graph, pq , qr and st represent
Chemistry · Class 12 · CBSE — Solutions
In the given graph, pq, qr and st represent
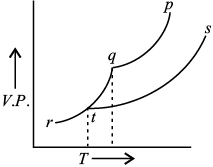
- pq → liquid state of solution, qr → solid state of solution, st → liquid state of solvent
- pq → liquid state of solvent, qr → solid state of solvent, st → liquid state of solution
- pq → liquid state of solvent, qr → solid state of solution, st → liquid state of solution
- pq → solid state of solvent, qr → liquid state of solvent, st → solid state of solution.
Answer
(B) pq → liquid state of solvent, qr → solid state of solvent, st → liquid state of solution
Sign up free on Edukali to view the step-by-step worked solution and practice thousands of similar questions.
Related practice questions
- Which one of the following units is useful in relating vapour pressure with the concentration of the solution?
- Which of the following is not an industrial or biological importance of osmosis?
- Intermolecular forces between n -hexane and n -heptane are nearly same as between hexane and heptane…
- Given below are few mixtures formed by mixing two components. Which of the following binary mixtures will…
- The value of Henry’s law constant for some gases at 293 K is given below. Arrange the gases in the increasing…
- An element with atomic mass 100 has a bcc structure and edge length 400 pm. The density of element is
- A solution is made by adding certain amount of solute X in water. Addition of a small amount of X in the…
- The van’t Hoff factor of 0.005 M aqueous solution of KCl is 1.95. The degree of ionisation of KCl is