Given is the graph between and P for 1 g of oxygen gas at two different temperatures T 1…
Physics · Class 11 · CBSE — Kinetic Theory
Given is the graph between  and P for 1 g of oxygen gas at two different temperatures T1 and T2, as shown in figure. Given, density of oxygen = 1.427 kg m–3. The value of PV/T at the point A and the relation between T1 and T2 are respectively
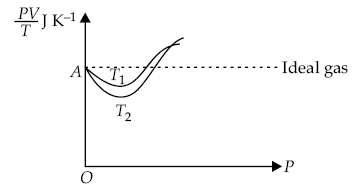
0.259 J K–1 and T1 < T2
- 8.314 g J mol–1 K–1 and T1 > T2
- 0.259 J K–1 and T1 > T2
- 4.28 g J K–1 and T1 < T2
Answer
(C) 0.259 J K –1 and T 1 > T 2
Sign up free on Edukali to view the step-by-step worked solution and practice thousands of similar questions.
Related practice questions
- If the pressure and the volume of certain quantity of ideal gas are halved, then its temperature
- A vessel has 6 g of oxygen at pressure P and temperature 400 K. A small hole is made in it so that oxygen…
- 1 mole of an ideal gas is contained in a cubical volume V , ABCDEFGH at 300 K as shown in figure. One face of…
- An insulated container containing monoatomic gas of molar mass m moving with a velocity v 0 . If the…
- A gas at 300 K has pressure 4 × 10 –10 N m –2 . If k B = 1.38 × 10 –23 J K –1 , the number of molecules per…
- A gas mixture consists of 2 moles of oxygen and 4 moles of Argon at temperature T . Neglecting all…
- 1 mole of H 2 gas is contained in a box of volume V = 1.00 m 3 at T = 300 K. The gas is heated to a…
- An air bubble of volume 1.0 cm 3 rises from the bottom of a lake 40 m deep at a temperature of 12 °C. To what…
More Kinetic Theory questions · Browse all practice questions