The energy levels of the hydrogen spectrum is shown in figure. There are some transitions…
Physics · JEE Advanced · NTA Exams — Atoms and Nuclei
The energy levels of the hydrogen spectrum is shown in figure. There are some transitions A, B, C, D and E. Transition A, B and C respectively represent
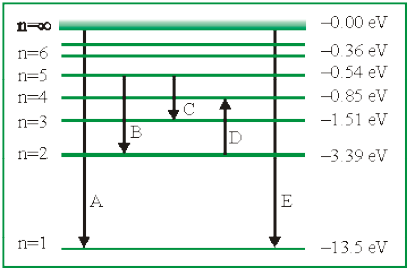
- First member of Lyman series, third spectral line of Balmer series and the second spectral line of Paschen series
- Ionization potential of hydrogen, second spectral line of Balmer series and third spectral line of Paschen series
- Series limit of Lyman series, third spectral line of Balmer series and second spectral line of Paschen series
- Series limit of Lyman series, second spectral line of Balmer series and third spectral line of Paschen series
Answer
(C) Series limit of Lyman series, third spectral line of Balmer series and second spectral line of Paschen series
Sign up free on Edukali to view the step-by-step worked solution and practice thousands of similar questions.
Related practice questions
- The half life of radioactive Radon is 3.8 days . The time at the end of which 1/20 th of the Radon sample…
- Assertion : Hydrogen atom consists of only one electron but its emission spectrum has many lines. Reason …
- The half life of the isotope _ 11 Na ^ 24 is 15 hrs . How much time does it take for 7 8 th of a sample of…
- The binding energies per nucleon for a deuteron and an - particle are x 1 and x 2 respectively. What will be…
- Assertion : Z X A undergoes 2α–decays. 2β–decays and 2γ–decays and the daughter product is Z–2 Y A–8 . Reason…
- What is the power output of 92 U 235 reactor if it takes 30 days to use up 2kg of fuel and if each fission…
- The cathode of a photoelectric cell is changed such that the work function changes from W 1 to W 2 ( W 2 > W…
- The minimum frequency ν of continuous X -rays is related to the applied potential difference V as
More Atoms and Nuclei questions · Browse all practice questions