Binding energy per nucleon plot against the mass number for stable nuclei is shown in the…
Physics · JEE Advanced · NTA Exams — Atoms and Nuclei
Binding energy per nucleon plot against the mass number for stable nuclei is shown in the figure. Which curve is correct
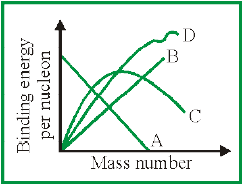
- A
- B
- C
- D
Answer
(C) C
Sign up free on Edukali to view the step-by-step worked solution and practice thousands of similar questions.
Related practice questions
- A radioactive nucleus undergoes a series of decay according to the scheme A A_ 1 A_ 2 A_ 3 A_ 4 If the mass…
- Photoelectric emission is observed from a metallic surface for frequencies ν 1 and ν 2 of the incident light…
- Statement-1 : If the accelerating potential in an X-ray tube is increased, the wavelengths of the…
- If the decay or disintegration constant of a radioactive substance is , then its half life and mean life are…
- The intensity of X-rays from a Coolidge tube is plotted against wavelength as shown in the figure. The…
- The figure shows the variation of photocurrent with anode potential for a photo-sensitive surface for three…
- The potential difference applied to an X -ray tube is increased. As a result, in the emitted radiation
- Which one of the following is true in photoelectric emission
More Atoms and Nuclei questions · Browse all practice questions