Which of the following figures correctly represent the shape of curve of binding energy…
Physics · Class 12 · CBSE — Nuclei
Which of the following figures correctly represent the shape of curve of binding energy per nucleon as a function of mass number?
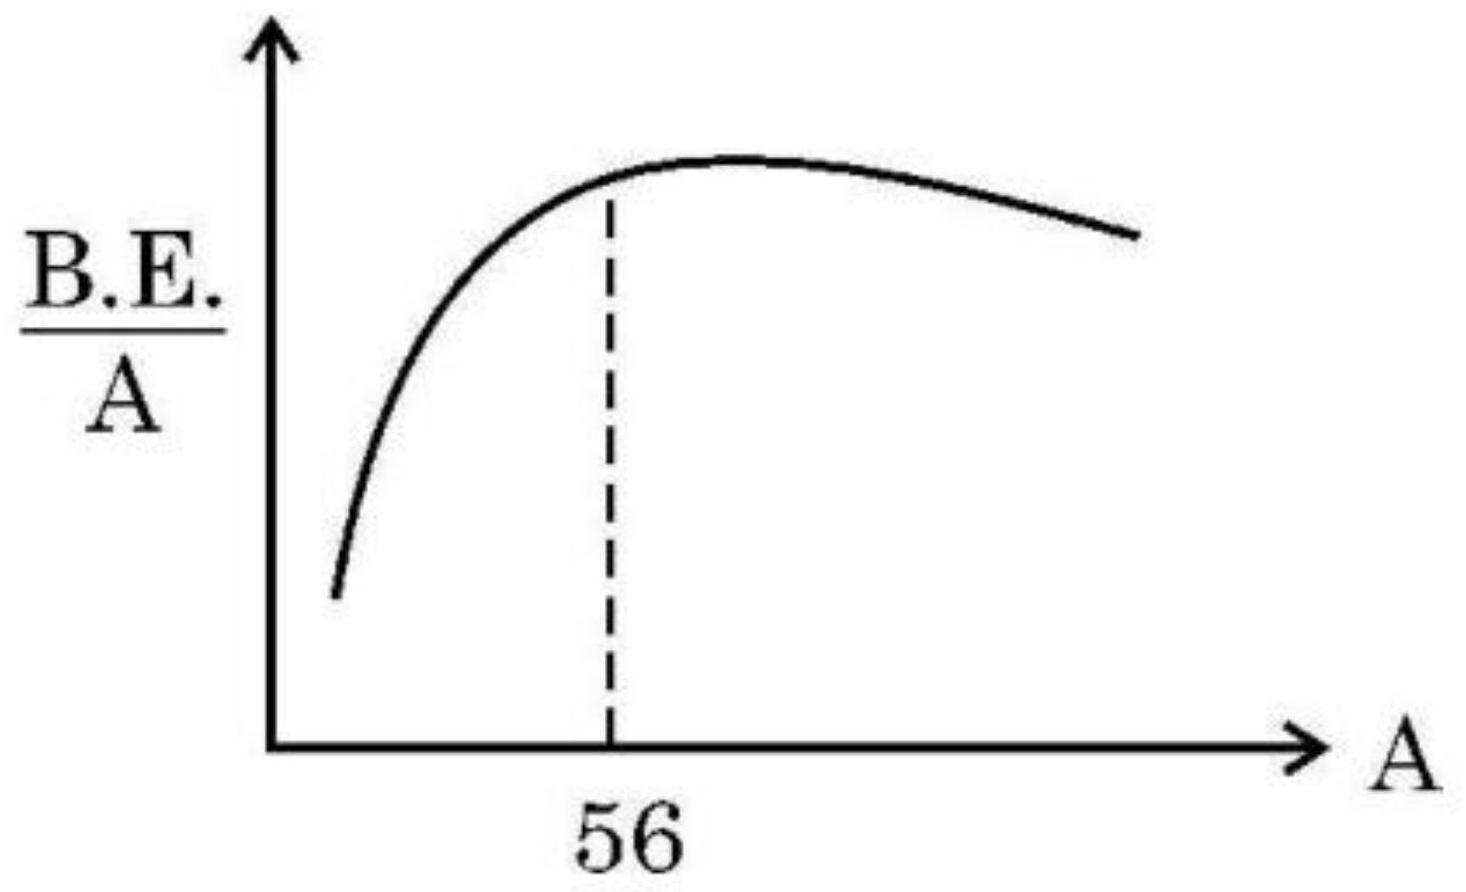
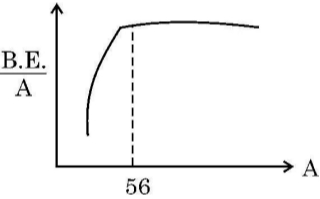
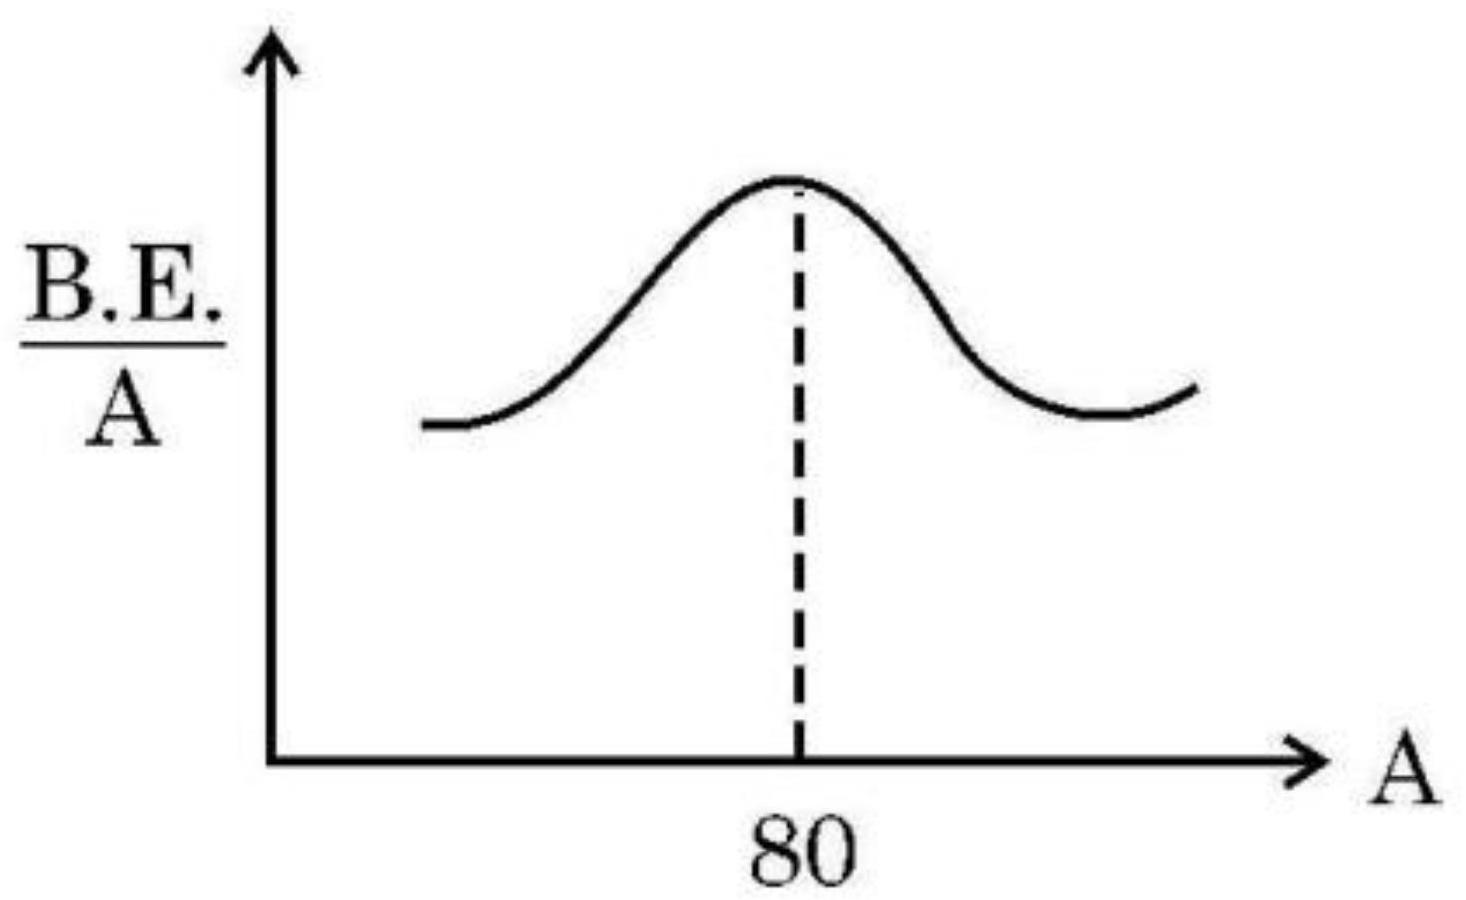
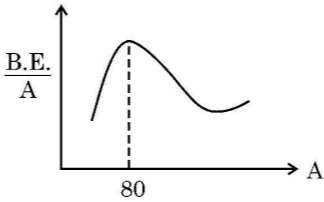
Answer
(B)
Sign up free on Edukali to view the step-by-step worked solution and practice thousands of similar questions.
Related practice questions
- How much mass has to be converted into energy to produce electric power of 500 MW for one hour?
- The wavelength of a photon needed to remove a proton from a nucleus which is bound to the nucleus with 1 MeV…
- At a given instant, there are 25% undecayed radioactive nuclei in a sample. After 10 seconds the number of…
- In the question number 66, what would be the angular momentum of H γ photon if the angular momentum of the…
- When two nuclei (A 10) fuse together to form a heavier nucleus, the:
- In Rutherford's nuclear model of the atom, the entire positive charge and most of the mass of the atom are…
- The half-life for radioactive decay of 14C is 5730 years. An archaeological artifact containing wood had only…
- Consider α and β particles and γ-rays each having an energy of 0.5 MeV. In the increasing order of…