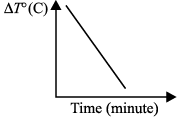
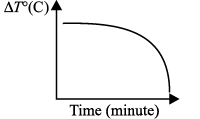
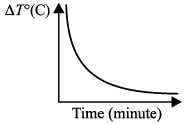
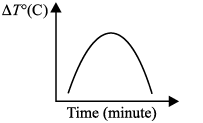
Which of the following graph is best explanation of cooling of hot water with time?
Physics · Class 11 · CBSE — Thermal Properties of Matter
Which of the following graph is best explanation of cooling of hot water with time?
Answer
(C)
Sign up free on Edukali to view the step-by-step worked solution and practice thousands of similar questions.
Related practice questions
- Two bars of same length and same cross-sectional area but of different thermal conductivities K 1 and K 2 are…
- A glass full of hot milk is poured on the table. It begins to cool gradually. Which of the following is…
- Which one of the following substances is highest specific heat capacity at room temperature and atmospheric…
- An ice cube of mass 0.1 kg at 0°C is placed in an isolated container which is at 227°C. The specific heat s…
- A bimetallic strip is made of aluminium and steel (α Al > α steel ). On heating, the strip will
- For transmission of heat from one place to the other, medium is required in
- If the temperature of the Sun were to increase from T to 2 T and its radius from R to 2 R . The ratio of…
- 10 g of ice at 0°C is mixed with 100 g of water at 50°C in a calorimeter. The final temperature of the…
More Thermal Properties of Matter questions · Browse all practice questions