Pressure versus temperature graph of an ideal gas of equal number of moles of different…
Physics · Class 11 · CBSE — Kinetic Theory
Pressure versus temperature graph of an ideal gas of equal number of moles of different volumes are plotted as shown in figure. Choose the correct alternative.
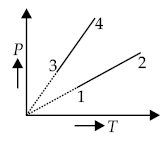
- V1 = V2 = V3 = V4
- V4 > V3 > V2 > V1
- V1 = V2; V3 = V4 and V2 > V3
- V1 = V2, V3 = V4 and V2 < V3
Answer
(B) V 4 > V 3 > V 2 > V 1
Sign up free on Edukali to view the step-by-step worked solution and practice thousands of similar questions.
Related practice questions
- If the pressure and the volume of certain quantity of ideal gas are halved, then its temperature
- In a certain region of space there are only 5 molecules per cm 3 on an average. The temperature there is 3 K…
- Three moles of oxygen are mixed with two moles of helium. What will be the ratio of specific heats at…
- When the temperature of a gas filled in a closed vessel is increased by 1 °C, its pressure increases by 0.4…
- A vessel contains two non-reactive gases neon (monoatomic) and oxygen (diatomic). The ratio of their partial…
- An inflated rubber balloon contains one mole of an ideal gas, has a pressure P , volume V and temperature T …
- A vessel has 6 g of oxygen at pressure P and temperature 400 K. A small hole is made in it so that oxygen…
- Two moles of a gas A at 27 °C mixed with a 3 moles of gas at 37 °C. If both are monoatomic ideal gases, what…
More Kinetic Theory questions · Browse all practice questions