The probability density plots of 1 s and 2 s atomic orbitals are given in figures. The…
Chemistry · Class 11 · CBSE — Structure of Atom
The probability density plots of 1s and 2s atomic orbitals are given in figures. 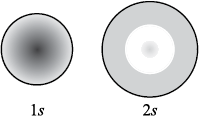
The density of dots in a region represents the probability density of finding electrons in the region.
On the basis of the given diagrams, which of the following statements is incorrect?
The density of dots in a region represents the probability density of finding electrons in the region.
On the basis of the given diagrams, which of the following statements is incorrect?
- 1s and 2s atomic orbitals are spherical in shape.
- The probability of finding the electron is maximum near the nucleus.
- The probability of finding the electron at a given distance is equal in all directions.
- The probability density of electrons for 2s-orbital decreases uniformly as distance from the nucleus increases.
Answer
(D) The probability density of electrons for 2 s -orbital decreases uniformly as distance from the nucleus increases.
Sign up free on Edukali to view the step-by-step worked solution and practice thousands of similar questions.
Related practice questions
- If uncertainty principle is applied to an object of mass 1 milligram, the uncertainty value of velocity and…
- The electron in Bohr’s model of hydrogen atom is pictured as revolving around the nucleus in order for it to
- According to Bohr’s theory, the angular momentum of an electron in 5 th orbit is
- How many number of electrons are present in a particle which carries a charge of 5.5 × 10 –16 C?
- In how many elements the last electron will have the following set of quantum numbers, n = 3 and l = 1?
- The angular momentum of an electron in a given stationary state can be expressed as m_ e w r=n h 2 . Based on…
- The number of radial nodes and angular nodes for d -orbital can be represented as
- The ratio of charge to mass of an electron in coulombs per gram was determined by J.J. Thomson. He determined…
More Structure of Atom questions · Browse all practice questions