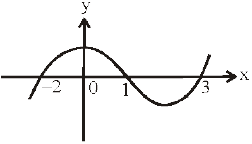
The graph of the function y = f (x) is as shown in the figure. Then which one of the…
Mathematics · JEE Advanced · NTA Exams — Sets, Relations and Functions
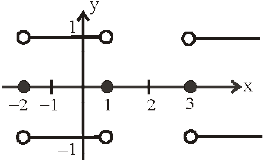
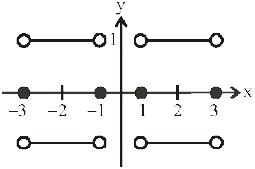
The graph of the function y = f (x) is as shown in the figure. Then which one of the following graphs are correct?
- |y| = sgn ( f (x))
- |y| = sgn (–f (|x|))
- |y| = | f | x ||
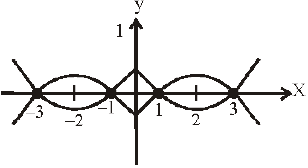
- y = xsgn (f (x))
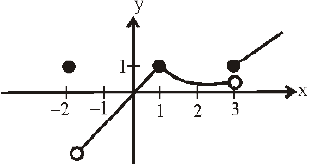
Answer
(A) |y| = sgn ( f (x)), (B) |y| = sgn ( –f (|x|))
Sign up free on Edukali to view the step-by-step worked solution and practice thousands of similar questions.
Related practice questions
- If for x R, 1 3 x^ 2 -2 x+4 x^ 2 +2 x+4 3, then 9.3^ 2 x +6.3^ x +4 9.3^ 2 x -6.3^ x +4 lies b/w
- If f : [0, ∞) → [0, ∞), and then f is
- Solution set of the inequality : 1 2^ x -1 > 1 1-2^ ( x -1) is
- The function f (x) = ( x) + sin –1 ( 1+x^ 2 2 x ) is defined for :
- The domain of the function f(x)= _ 3 [- _ 1 / 2 (1+ 1 x^ 1 / 5 )-1 ] is
- If | x – 1| + | x | + | x + 1| > 6 ; then x lies in
- The domain of the function f( x )= x - 1- x ^ 2 is
- Let f (x) be invertible function and let f –1 (x) be its inverse. Let equation f f –1 (x) = f –1 (x) has two…
More Sets, Relations and Functions questions · Browse all practice questions