The potential energy diagram for a reaction X → Y is given. A and C in the graph…
Chemistry · Class 12 · CBSE — Chemical Kinetics
The potential energy diagram for a reaction X → Y is given. A and C in the graph corresponding to
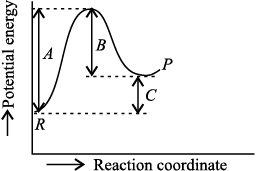
- A → activation energy, C → DH°
- A → energy of reactants, C → energy of products
- A → DH°, C → activation energy
- A → activation energy, C → threshold energy
Answer
(A) A → activation energy, C → D H °
Sign up free on Edukali to view the step-by-step worked solution and practice thousands of similar questions.
Related practice questions
- In a reaction, 2 X → Y , the concentration of X decreases from 0.50 M to 0.38 M in 10 min. What is the rate…
- Which of the following is an example of a fractional order reaction?
- For a reaction R → P , the concentration of a reactant changes from 0.05 M to 0.04 M in 30 minutes. What will…
- Rate of a general reaction A + B → products can be expressed as follows on the basis of collision theory…
- Consider the reaction P → Q . The concentration of both the reactants and the products varies exponentially…
- The half-life of the reaction X → Y , following first order kinetics, when the initial concentration of A is…
- In a pseudo first order hydrolysis of ester in water, the following results were obtained. t / s 0 30 60 90…
- The following data were obtained during the first order thermal decomposition of SO 2 Cl 2 at a constant…
More Chemical Kinetics questions · Browse all practice questions