The figure shows the voltage (V) versus the current (I) graphs for a wire at two…
Physics · Class 12 · CBSE — Current Electricity
The figure shows the voltage (V) versus the current (I) graphs for a wire at two temperatures \({T}_1\) and \({T}_2\) . One can conclude that:
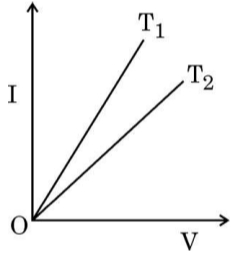
- T1 > T2
- T1 < T2
- T2 = 2T1
- \({T}_1={T}_2 / 3\)
Answer
(A) T 1 > T 2
Sign up free on Edukali to view the step-by-step worked solution and practice thousands of similar questions.
Related practice questions
- If N is Avogadro number, M is atomic weight and , the density, the number of free electrons per unit volume…
- An electric kettle boils some water in 16 min. Due to some defect, it becomes necessary to remove 10% turns…
- The masses of two cylindrical wires of copper are in the ratio of 1 : 3 and their lengths are in the ratio of…
- The resistance of a wire at a temperature t o C and 0 o C are related by:
- A battery supplies 0.9 A current through a 2 resistor and 0.3 A current through a 7 resistor when connected…
- For a metallic conductor, the correct representation of variation of resistance R with temperature T is:
- A block of pure silicon at 300 K has a length of 10 cm and an area of 1.0 cm 2 . A battery of emf 2 V is…
- The internal resistance of a 2.1 V cell which gives a current of 0.2 A through a resistance of 10 is:
More Current Electricity questions · Browse all practice questions