The graph shows variation of v with change in u for a mirror. Points plotted above the…
Physics · JEE Advanced · NTA Exams — Optics
The graph shows variation of v with change in u for a mirror. Points plotted above the point P on the curve are for values of v
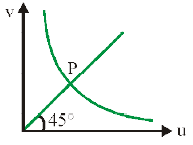
- Smaller than f
- Smaller than 2f
- Larger than 2f
- Larger than f
Answer
(C) Larger than 2f
Sign up free on Edukali to view the step-by-step worked solution and practice thousands of similar questions.
Related practice questions
- Angle of a prism is 30° and its refractive index is 2 and one of the surface is silvered. At what angle of…
- A lens of power +2 diopters is placed in contact with a lens of power –1 diopter. The combination will behave…
- Four light waves are represented by (i) y=a_ 1 t (ii) y=a_ 2 ( t+ ) (iii) y=a_ 1 2 t (iv) y=a_ 2 2( t+ )…
- A cubical vessel has opaque walls. An observer (dark circle in figure below) is located such that she can see…
- One face of a rectangular glass plate 6 cm thick is silvered. An object held 8 cm in front of the first face…
- A double convex lens, made of a material of refractive index µ 1 , is placed inside two liquids or refractive…
- Statement-1 : A fish inside a pond will see a person standing outside taller than he actually is. Statement-2…
- An optical fibre consists of core of µ 1 surrounded by a cladding of µ 2 1 . A beam of light enters from air…